Bring your holdings
Search by company, enter weights, or paste and import a CSV. Check which stocks have model coverage before saving.


Transformer-powered research for your portfolio
Quantrose’s transformer model produces stock forecasts and relative rankings. Bring your holdings to examine those outputs alongside measured price relationships and historical portfolio comparisons. When you want help interpreting the evidence, ask Rosetta, your optional local AI companion.
Standard £30/month · Plus £200/month. Payment checkout is not connected. Creating an account does not activate portfolio access.
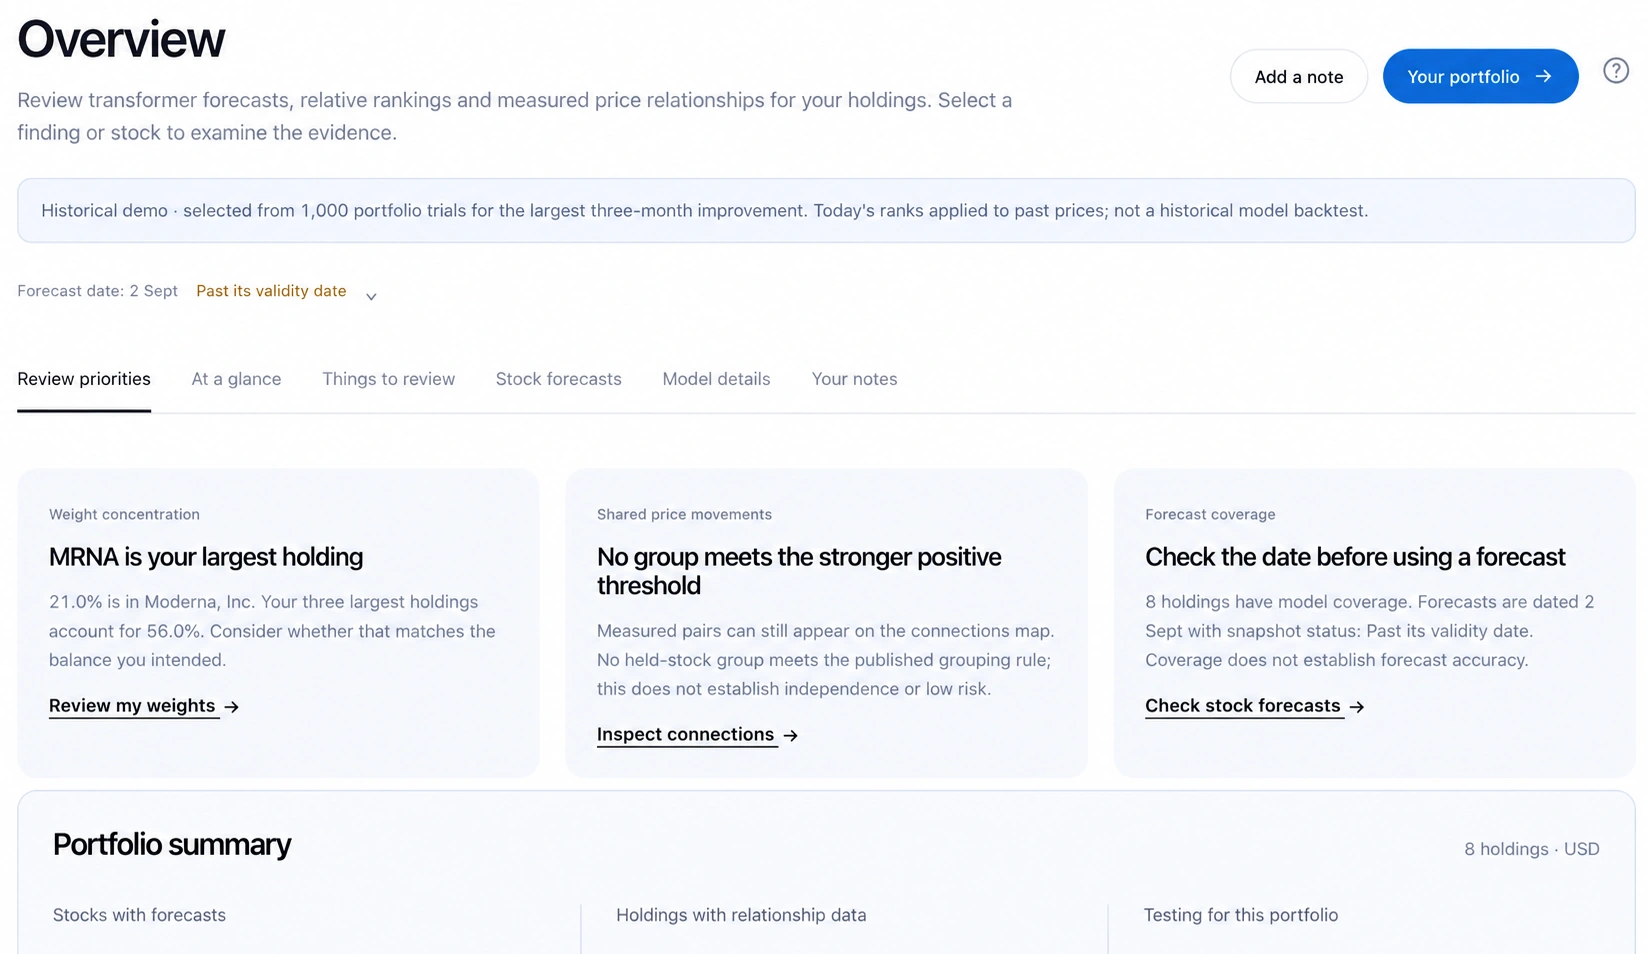
The actual workspace, using historical sample holdings. Forecast and observation dates are shown inside the product; this is not a live market feed.
Using Quantrose
Start with your own holdings or choose the demo. Each weight is the percentage of your invested stocks allocated to a company. You can save unsupported tickers, but forecasts and historical comparisons depend on data coverage.
Search by company, enter weights, or paste and import a CSV. Check which stocks have model coverage before saving.
Compare transformer forecasts and ranks for your stocks, inspect measured connections, and check the dates and research evidence. Rosetta can help interpret what you find.
Edit a draft and compare it using available past prices. Save a new version and a note when you want to keep your research.
For stocks covered by the model, inspect an estimated return range and a central estimate. The central estimate is the model’s median forecast. Select a company to see the forecast period, data date and available quality checks.
Create an accountPayment checkout is not connected. Creating an account does not activate portfolio access.
The central marker sits within an estimated return range.
The relationship map uses past price movements to connect holdings. It helps you examine whether several stocks have behaved similarly, even when they belong to different companies. These relationships may change over time.
Create an accountPayment checkout is not connected. Creating an account does not activate portfolio access.
Connections illustrate related past price movements.
Compare your saved weights with a draft over one, three or six months of available prices. See the simulated ending value, trading costs and largest fall from a previous peak. Plus also lets you create an experimental draft based on model ranks.
Create an accountPayment checkout is not connected. Creating an account does not activate portfolio access.
This applies selected weights to past prices. It does not show what the model would have recommended at the time.
The intelligence engine
Quantrose’s trained transformer is the engine behind its stock return forecasts and relative rankings. Explore its outputs, uncertainty and available historical testing directly. Measured price relationships and historical portfolio comparisons add separate perspectives; Rosetta helps explain the evidence when you want a conversation.
See the toolsModel rank compares a company with the other covered stocks. Rank 1 is highest. A rank is a relative model result, rather than a recommendation to buy.
A central estimate gives the model’s median forecast. The range shows lower and upper estimates for the stated period. Check the forecast date and available quality checks alongside the numbers.
The Research page shows available historical studies and their limitations. A historical comparison of your weights answers a different question: how that allocation would have performed using past prices.
Meet Rosetta · your local research companion
The transformer provides the forecasts and rankings. Rosetta helps you interpret them. Ask about a forecast, explore a measured stock connection, or investigate business drivers with current public sources. Her optional language model runs locally in your browser; her explanations sit alongside the underlying intelligence.
Explore QuantroseOptional download after signing in. Requires a compatible WebGPU browser and enough device memory. Portfolio access requires an active subscription; checkout is not connected yet.

Let’s make sense of your market intelligence.
“Why might these two stocks move together?”
“What could explain this company’s forecast?”
“Which business drivers do my holdings share?”
Rosetta generates answers on your device. Your prompts and chat are not sent to a hosted AI model. Your saved holdings and account data still use Quantrose’s service.
Internet research uses company identifiers, dates and public topic labels—not your full question or portfolio weights. Switch it off whenever you want.
Inspect the measurements, source excerpts and citations behind an answer. Rosetta helps you research; AI explanations can be wrong and need your judgement.
Ways to use Quantrose
Use an individual account to review a personal portfolio or evaluate the tools for your research.
 For individuals
Examine available forecasts for your stocks and check which holdings have moved together. Save notes about results you want to investigate.
Create an accountPayment checkout is not connected. Creating an account does not activate portfolio access.
Change the percentage allocated to each stock and compare the draft with your saved portfolio. Save a new version when you want to keep those weights.
Compare a draftPayment checkout is not connected. Creating an account does not activate portfolio access.
 For businesses
Plus supports more portfolios and lets you inspect how tested groups of model inputs affect stock rankings. Access is through individual accounts.
Create an accountPayment checkout is not connected. Creating an account does not activate portfolio access.
Business evaluation uses individual workspaces; shared team access and enterprise integrations are not offered.
Research evidence
The Research page shows available historical testing, source dates and saved portfolio versions. Check which model was evaluated and whether the results support a clear conclusion before relying on a forecast.
Plans and access
Standard supports a repeatable review of one personal portfolio. Plus supports multiple portfolios and deeper experiments with model inputs and rank-based drafts. Neither plan promises better investment returns.
Standard
For reviewing one personal stock portfolio.
Plus
For comparing several portfolios and investigating model behaviour.
Portfolio tools require active subscription access. Payment checkout is not connected, so creating an account or choosing a plan does not activate access. Holding limits describe storage capacity; forecasts depend on model coverage.
About the service
Enter tickers or company names, paste two columns, or import a CSV with ticker and percentage weight. The coverage preview identifies stocks with model forecasts in the loaded snapshot. Holding limits are storage limits, not a promise of model coverage. Cash, shorts and currency conversion are not supported; the current workspace uses USD stock portfolios.
Rosetta explains your holdings, Quantrose forecasts and measured stock relationships in a conversation, using portfolio evidence and optional current internet research. Her language model runs in your browser. The separate market intelligence model supplies stock forecasts; Rosetta interprets those outputs and does not generate or verify them. Check her explanations against the cited evidence.
Rosetta’s answer generation, questions and conversation stay on your device. Saved portfolios and accounts use Quantrose’s API. Internet research sends company identifiers, dates and public topic labels to public providers through the service, never your full question or portfolio weights. Optional model files download from Hugging Face. You can turn internet research off, unload the model and remove downloaded files.
A compatible secure-context browser with WebGPU support and enough GPU memory and storage. Choose the Research model (about 2.3 GB download and about 4 GB GPU memory) or Lightweight (about 300 MB and about 1 GB GPU memory). Downloads start only when you choose. Local analysis speed and answer quality depend on your device and selected model; the smaller option has less reliable reasoning.
Quantrose provides research tools for examining stocks and portfolio weights. It does not assess your personal financial circumstances or provide an adviser’s financial planning service.
Yes, where complete price history is available. Choose a starting value, trading-cost assumption and a one-, three- or six-month window. The comparison applies your selected weights to past prices. It is a simulation, rather than your actual investment record or evidence that the model would have chosen those weights.
You can evaluate the tools through an individual account. Plus provides larger portfolio limits and model input tests. Shared team accounts, enterprise integrations and automated trading are not offered.
Standard is £30 per month for one portfolio with up to 20 holdings. Plus is £200 per month for up to 10 portfolios, each with up to 500 holdings, plus model input tests and experimental drafts. Checkout is not connected yet. Development access can be simulated for testing, without taking payment.
Account registration
Payment checkout is not connected. Registration does not activate portfolio access.